Assignments
-
Turning Data into Information
This particular course provided by ESRI's Virtual Campus introduces GIS users to basic spatial data structures, sources of error, and basic spatial analysis. This module included six modules: Basics of Data and Information, Cartography, Map Production, and Geovisualization, Query and Measurement, Transformations and Descriptive Summaries, Optimization and Hypothesis Testing, and Uncertainty. I'll describe each of the six modules in more detail below.
Read more... -
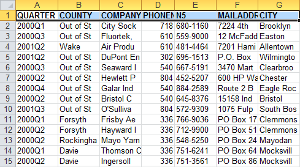
Geocoding Tabular Data
A local business has chosen me to conduct a geographic analysis of their customer base near Raleigh, North Carolina. The goal of the analysis is to assist the business in targeting an advertising campaign to expand their customer base in Wake County, North Carolina. The business collects customer address information, but is unsure how to visualize their customer base on a map. My job is to convert their database of customers into a geographic dataset that can be used to conduct further spatial analysis.
Read more... -
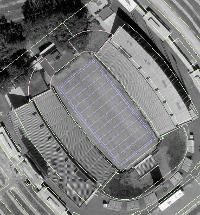
AutoCAD Integration
The NC State administration has asked that the GIS Department take over the management of the facilities inventory supporting campus planning. To this point the Campus Masterplan has been managed through Computer Aided Design (CAD) software. I have been tasked with transitioning the data from AutoCAD to an ESRI Geodatabase.
Read more... -
Data Cardinality
My GIS department has been contacted by our State representatives to analyze the results of an industrial extension jobs survey for the upcoming elections. The representatives are interested in showing how their policies have created jobs, and to compare their successes to neighboring districts. I will be making extensive use of both tabular and spatial joins to combine spatial data with the survey results.
Read more... -
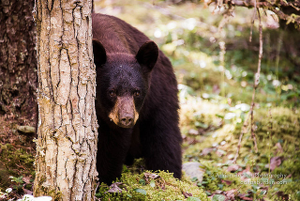
Suitability Analysis and Weighted Overlay
A recent trend in park visitors across the U.S. attempting to take Bear Selfies has led to increased interaction between bears and humans. Despite warnings park visitors continue to try to approach bears to post photos to instagram and other photo sharing services. Capturing and re-locating bears has proven to be unsuccessful as the bears continue to return. Based on several factors we will need to identify the safest areas for bears to reduce the amount of bear-human interaction.
Read more... -

Working with US Census Data
For this assignment I mapped the estimated median earnings for residents of Fulton County, Georgia from the last twelve months with data from the US Census American FactFinder. The table I used contained lots of information on earnings by demographics, gender, and education. The field I used from this table represents Total Estimate Median earnings (dollars) for a given census tract.
Read more... -
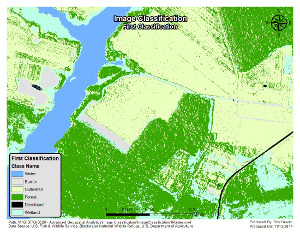
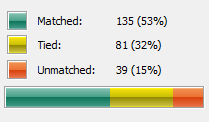
Image Classification
The Blackwater Wildlife Refuge in Cambridge, Maryland is in need of updating it's Refuge Management Plan. This serves as an opportunity to update several GIS layers that were developed for the last plan written five years ago. We now have National Agriculture Imagery Program (NAIP) data from 2010 from which we can derive a land-cover dataset. The classification of land-cover types from this analysis will be used for the rest of the aerial imagery of the refuge in the new Management Plan, and will become the canonical land-cover dataset for the refuge moving forward.
Read more... -
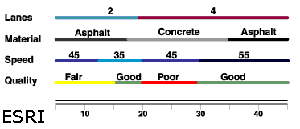
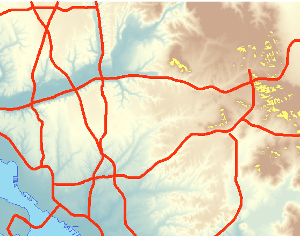
Linear Referencing
This assignment covers the use of GIS to apply attributes to specific segments of a line with a technique called Linear Referencing. More specifically I analyzed the occurrence of accidents along segments of a road network and compared those accidents against both the type of material of the road, and the road's condition.
Read more... -
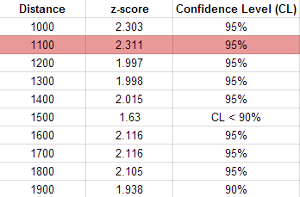
Spatial Statistics
The problem presented in this assignment is to apply spatial statistics methods to get a better understanding of the spatial distribution of Emergency Medical Service (EMS) calls. These tools generally find the presence or absence of clustering/dispersion on either attribute values, the geographic location itself, or both.
Read more... -
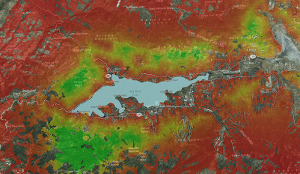
Using Raster Data for Site Selection
For this exercise I have been contacted by the California State Department of Natural Resources to model Bald Eagle habitat around Big Bear Lake in the San Bernardino National Forest. Rather than a traditional raster-cell based analysis I’ve been asked to conduct a fuzzy-tolerance analysis to account for the Bald Eagle’s instinctual site selection tendencies. This can often give more accurate results as animals are not bound to polygon boundaries, and do not see the world through 30 square meter raster cells.
Read more... -

Elementary Customization of ArcMap
The City of Oleander's GIS department recently had lots of employee turnover with several retiree positions being filled by recent college graduates. The GIS manager for the department sees this as an opportunity to standardize how business is done, and would like to create some common training tools and manuals for the new employees. I, the remaining GIS Analyst, volunteered to codify my analysis steps and procedures by customizing the ArcMap interface for all computers in the GIS lab as a first step. I began by creating two new toolbars: an Oleander toolbar containing Save Edits, Start Editing, Stop Editing, Use Snapping, and Run EasyCalculate10 commands as well as a drop down menu called Select view, which allows the user to easily switch between data and layout views. The second toolbar is called Fast Edits, which brought together the Save Edits, Edit Tool, Rotate Tool, and Curve Calculator commands. Finally, I added the `Open Table with Selected Features` command to the feature layer context menu in the Table of Contents.
Read more...
subscribe via RSS