Image Classification
Geospatial Analytics with Raster Data
Part I: Exercise Overview
Problem
The Blackwater Wildlife Refuge in Cambridge, Maryland is in need of updating it’s Refuge Management Plan. This serves as an opportunity to update several GIS layers that were developed for the last plan written five years ago. We now have National Agriculture Imagery Program (NAIP) data from 2010 from which we can derive a land-cover dataset. The classification of land-cover types from this analysis will be used for the rest of the aerial imagery of the refuge in the new Management Plan, and will become the canonical land-cover dataset for the refuge moving forward.
Analysis procedures:
Strategies
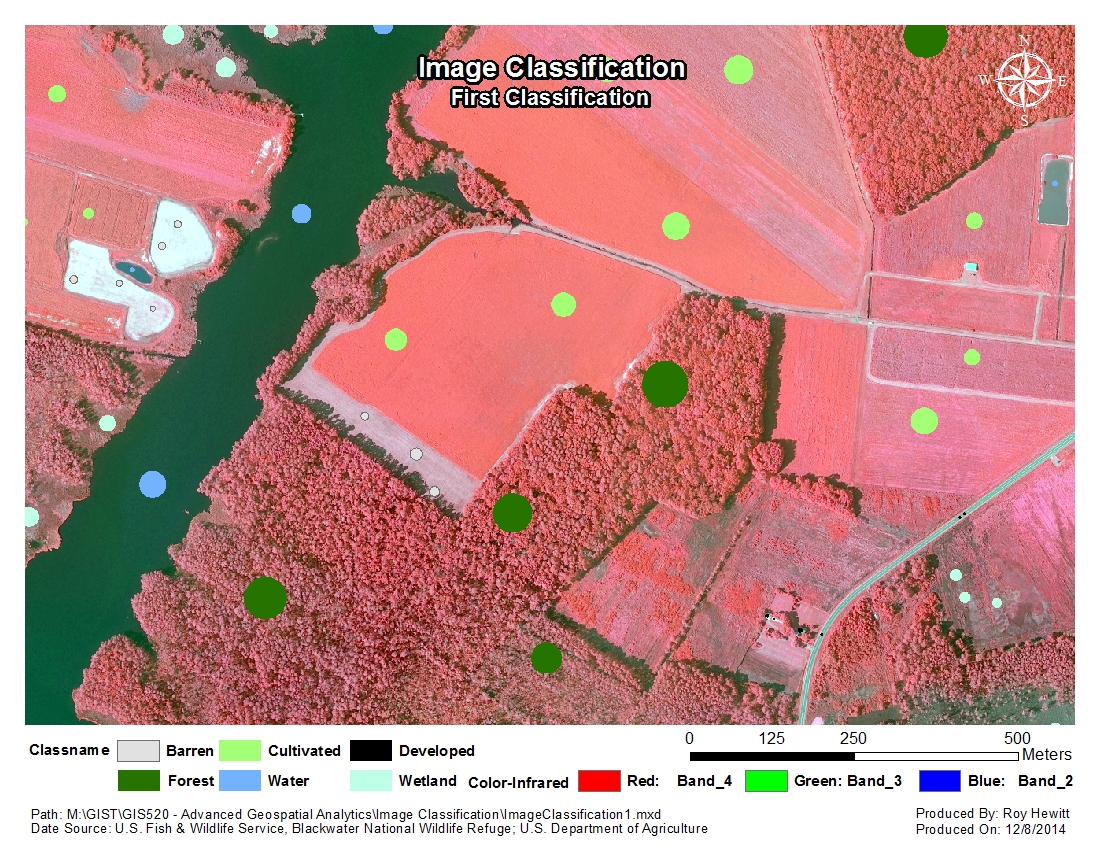
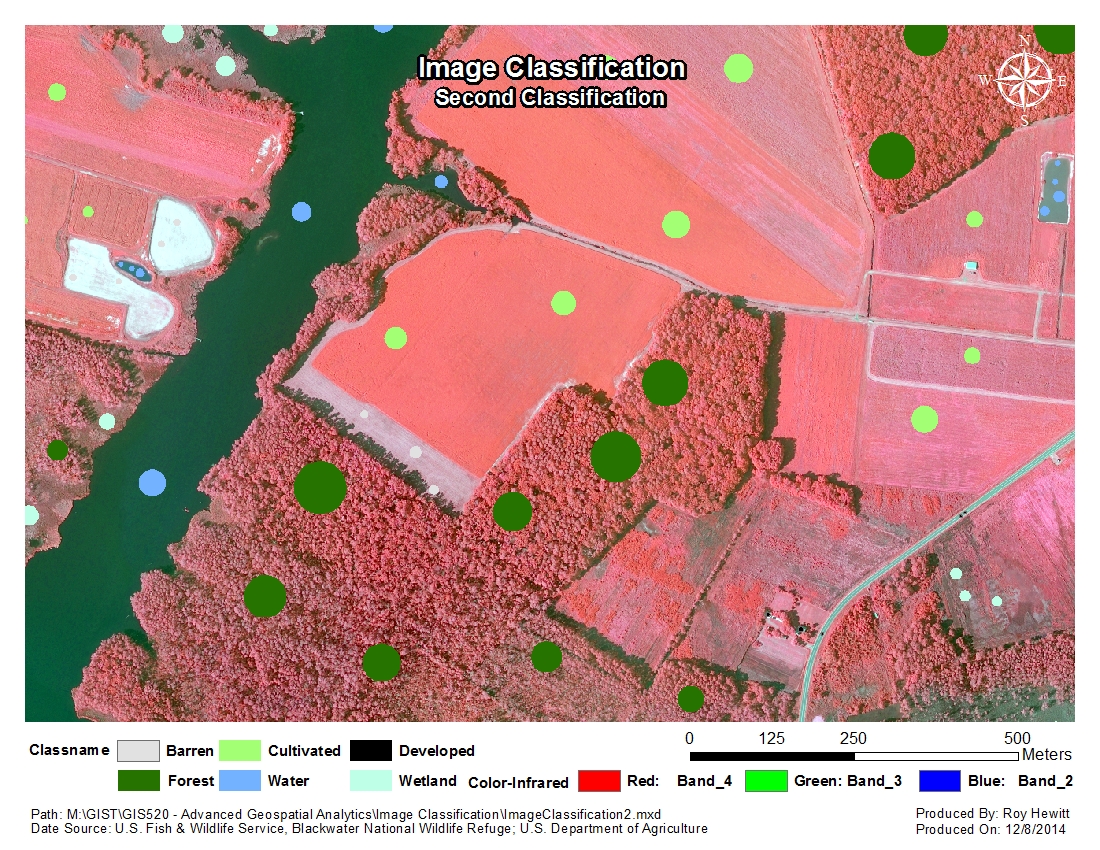
To create a land-cover surface from aerial imagery I used the Image Classification tools from ArcGIS’s Spatial Analyst extension. The input aerial image is collected by the USDA Farm Service Agency as a four band raster. The spectral resolution is a natural color (red, green, blue, or RGB) and infrared bands. Since the infrared wavelength shows signatures that we cannot differentiate with the naked eye I converted the natural color (RGB) image to a color-infrared image by re-ordering the bands, and including the infrared band instead of the red band. I then created sample polygons for each of the six land-cover categories to conduct a supervised classification. Finally I calculated the total area of each land-cover class with the field calculator. I repeated these steps for a second round of supervised classification after I found specific areas, namely water impoundments, that were not properly classified during the first analysis. This required the addition of several new sample polygons in addition to the first set.
Methods
Conducting an image classification of aerial photography required that I train the computer to recognize certain pixel values from three different bands (green, blue, infrared). In order to create an accurate land-cover dataset using a supervised image classification you need to account for the variation in pixels within the different classes. Keeping that in mind I tried to select areas from the impoundments as well as the northern and southern most portions of the waterbody, which because of their depth, and nadir angle from the camera had different reflective properties. For cultivated land there were several areas that had distinct signatures including the darkest red area in the infrared image, which represents healthy crops, crops that had tractor trails through them and areas that had seemingly been harvested already. No matter the class, it was important to create polygons that were largely homogeneous as to grab their defining qualities for the classification engine to compare against all other pixels in the image. Once the raster was created I converted it to an ESRI Grid, which resulted in one row per class and contained a count of the number of raster cells in that particular classification. With the knowledge that a single cell is 0.3m squared, which when multiplied by the number of cells for that class will result in the total area for each class.

Discussion
Difficulties Encountered
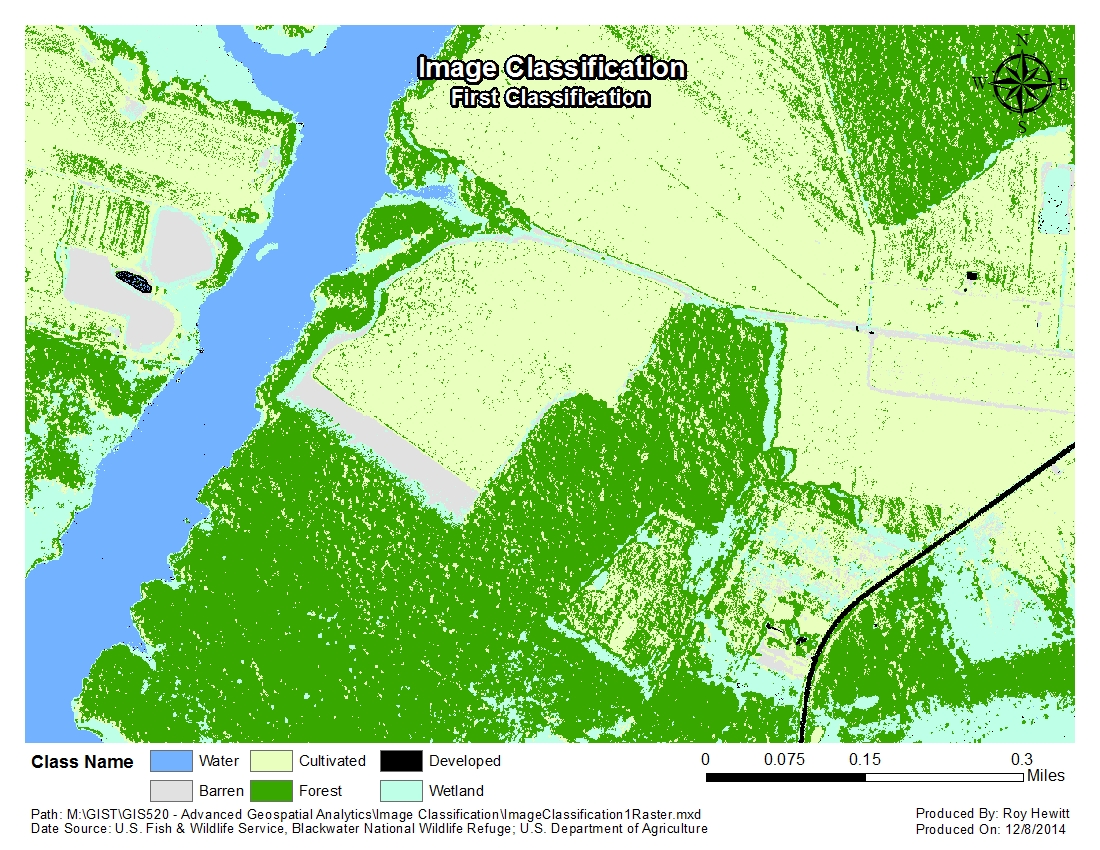
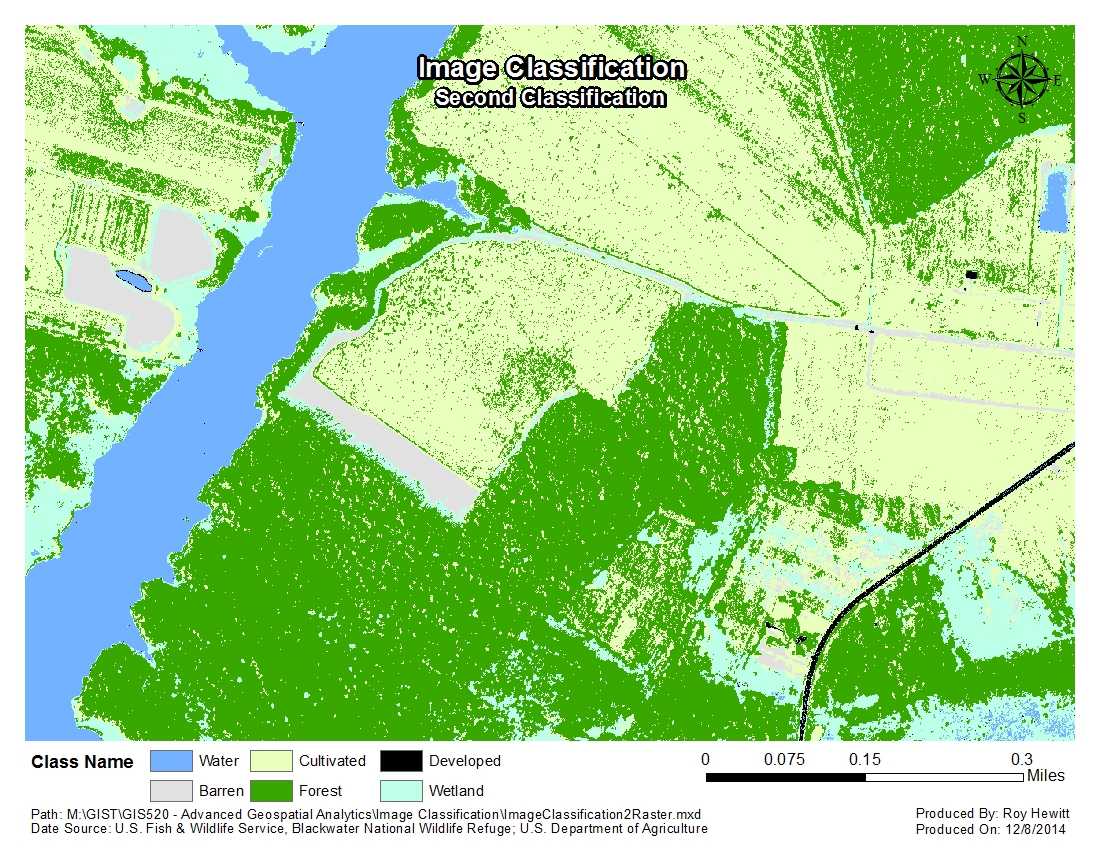
As with any image classification it is really difficult to get a perfect final product. After my first series of sample polygons I found that the water impoundments were classified as Developed. Upon further inspection the roof of the farm house had a very similar visual reflectance to the impoundments. To correct the problem I added additional control points in both of the impoundments, which were better categorized as Water in the second analysis. Even with the additional control points the edges of one impoundment were still identified as class Developed.
Evaluation
A visual analysis showed improvement between the first and second version of the image classification. I have prior knowledge of the particular work site as I worked at Blackwater NWR upon finishing my undergraduate degree. The area is densely covered in a combination of tidal marsh, agriculture, and silvaculture with very limited development. The particular aerial image we analyzed contained two water impoundments likely used for agricultural purposes. In general the Water class seemed to be most often misclassified. There were small pixels throughout the open water body that were incorrectly classified as both developed, and marsh. After adding additional reference polygons these small errors seemed to be rectified. Additionally these changes seemed to reclassify some particularly low/wet/unvegetated wetlands in the Southeastern most portion of the photograph as Water rather than Wetlands. This seems to be accurate but may be heavily dependent on when the photo was taken in relation to the most recent precipitation event.
Application and Reflection
In more natural environments that are more “untouched” by development we often see many more land-cover classes. In these cases we also often break down a single class link Forest into several categories including Shrub/Scrub, Deciduous, Coniferous each contributing it’s own habitat factors to specific species. It’s important to note that land-cover image classification and most remote sensing catches only the Earth’s surface and at most a small portion of subterranean habitats. It’s true that certain areas of the electromagnetic spectrum are helpful in determining soil moisture, and water depth, but that doesn’t tell the entire story for many species. The Gopher Tortoise requires specific types of soil to create their burrows we can include supplemental datasets like SSURGO that represent soil types and their associated attributes. The combination of several layers can help us model the most appropriate habitat for Gopher Tortoise relocations, and restoration efforts to recover the species.
Problem description
Southeastern Wildlife Refuges need to update their refuge landcover layers, which are used by GIS staff to conduct analyses of present animal species.
Data needed
The common data layer that is available across the entire Southeast region is the NAIP imagery flown by the USDA Farm Service. This imagery includes four bands composing a color infrared image. We also need to do some research on the spectral reflectance of different groups of tree species.
Analysis procedures
Once we have the NAIP imagery downloaded from the USDA Data Gateway we can open up dedicated image classification software like eCognition or ENVI. While ArcGIS is capable of image classification it’s roots are in vector analysis. Other software packages began strictly in raster image analysis and can offer more accurate results. Using eCognitions spectral graphs for our NAIP imagery we can select specific portions of the spectral range to classify hardwoods from coniferous trees. In order to accurately separate tree species we need to rely on the research of other colleagues who have isolated the spectral reflectance of specific tree species. Armed with this information we can select very small windows of the electromagnetic spectrum to separate classes that might otherwise be clumped together with a more basic supervised classification. Once we have our analysis completed we need to go out into the refuge to ground truth our vegetation model. We can randomly select locations within the map and determine if our classification correctly identified the species present on the ground.
Part II: Discussion of Differences between Classifications
Calculation of land cover class area
I calculated the area for each land-cover class by multiplying the area of each raster cell (0.3m squared) by the total count of cells that fell in that class. I used the field calculator with the following expression: AREA = (0.3 * 0.3) * [COUNT].
Image Classification by Acreage
First Pass at Image Classification

Second Pass at Image Classification

Discussion of Results
The two image classification attempts were reasonably accurate compared to the original. The two areas that seemed to contain the most error were the water impoundments, a shallow portion of the waterbody, and portions of the forest that were represented as Cultivated due to low texture. In a normal land-cover dataset there would be a Shurb/Scrub class that would catch many of the areas in the cultivated fields that were miscategorized as Forest.
Adjustments made between the two attempts at image classification seemed to correct some issues in certain classes, namely Water and Development, while reducing the accuracy of other classes like Cultivated and Forested. The impoundments in round one of the analysis were almost completely miscategorized, but in the second pass they fell into the correct class of Water with the exception of the boundary of the western impoundment, which was categorized as Developed. Alternatively, the differentiation between Forested and Cultivated became less accurate with the second analysis. I added several control points in areas that did not contain as much texture in the forested area. This made the second analysis incorrectly categorize the cultivated fields that had been altered with a tractor to be miscategorized as Forest because they had increased levels of texture.
Final Products:
Input Sample Polygons


Output Landcover Classification

