Data Cardinality
Geospatial Analytics with Vector Data
Problem
My GIS department has been contacted by our State representatives to analyze the results of an industrial extension jobs survey for the upcoming elections. The representatives are interested in showing how their policies have created jobs, and to compare their successes to neighboring districts. I will be making extensive use of both tabular and spatial joins to combine spatial data with the survey results.
Analysis Procedures
Strategies
This exercise requires the use of both tabular and spatial joins in ArcGIS. The industrial extension jobs survey is presented in the form of an excel table. I was able to retrieve the other two datasets through the NC State GIS library, and ArcGIS online. Once I prepared all of the layers for analysis by selecting only the data that falls within North Carolina I was able to begin the analysis. First I’ll combine data from different companies by zip code, and connect this data to the point shapefile of zip code centroids. I’ll then use a spatial join to connect data from zip codes to individual House and Senate districts.
Methods
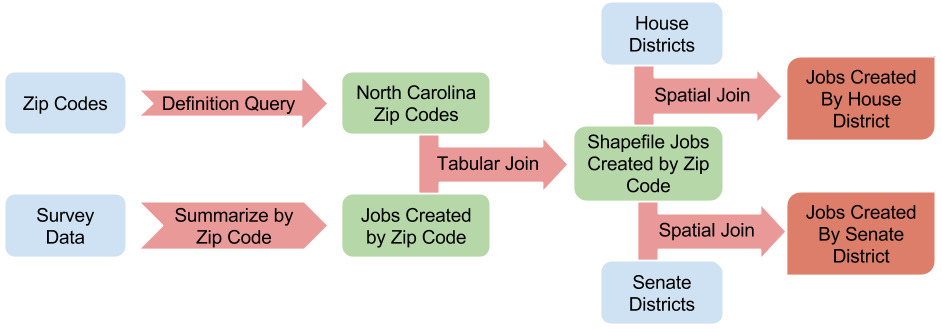
To complete this exercise, first I converted the tabular data from having a single record per company in our area interest to a single row for each zip code while summing the total number of jobs created using the summarize tool in the attribute table. At this point I quickly checked my work by selecting all of the records from the original dataset with the single summarized dataset to ensure they had the same number of jobs created. I then joined the table to the shapefile of zip codes in North Carolina that were represented as points with a tabular join. Finally I spatially joined the zip code points containing the total number of jobs created to individual House and Senate districts, which I used to display the results.

The diagram above shows the steps used to complete this exercise. Input datasets are in blue, processing steps are in light red, intermediate datasets are in green, and exercise outputs are in dark red.
Discussion
Difficulties
The main difficulty I ran into while trying to complete this exercise was the difference between the Spatial Join Geoprocessing tool and the Spatial Join tool available when right-clicking a layer in the ArcMap Table of Contents. The Geoprocessing tool does not appear to allow the user to dictate which field should be aggregated when there is a one-to-many relationship between the target and join features. I kept checking my answer by comparing the inputs with the final product and found that the total jobs created was not being summed. I then used the spatial join option by using the right-click method in the TOC and was able to choose the merge operation (sum), and this operation was applied to all fields.
The other difficulty I had when trying to map the results was that there were several null values in my completed House Districts dataset. When I tried to map the number of jobs created any district with a value of null was omitted. To fix this issue I opened an editing session and the field calculator. I used the following simple Python function to replace null values with a value of zero:
def updateValues(value):
    if value is None:
        return 0
    else:
        return value

updateValues(!EMPLOY_SUM!)
Evaluation
I was able to check my work throughout the process to ensure it’s accuracy. For example after each join/sum step I would compare a subset of the original dataset with the corresponding subset of the resulting dataset to ensure the numbers matched. If they did not I re-considered how I approached the problem as mentioned above where I changed how I completed the spatial join. As such I am very confident in the results of my analysis.
Application & Reflection
Problem description
We need to conduct recurring water quality surveys at known locations at several times throughout the year.
Data needed
Location information for the survey locations, which are most likely provided as a point feature class.
Analysis procedures:
Tabular joins are very useful when conducting surveys. If, for example, you go into the field to visit a list of survey locations on a regular basis to collect water quality information the survey location information and the data you collect should be managed in separate tables. If I keep a point feature class of survey locations I can load those points into my GPS, which will help in finding the locations when I’m in the field. In a second, related table, I can manage all of the water quality information that I collect with each row in the table representing a distinct trip into the field. Managing data in this way also precludes the need to collect data about the location itself (location id, location description, etc.) that will very likely remain the same. This reduces the total amount of data that I need to collect, and reduces redundancy in the database.

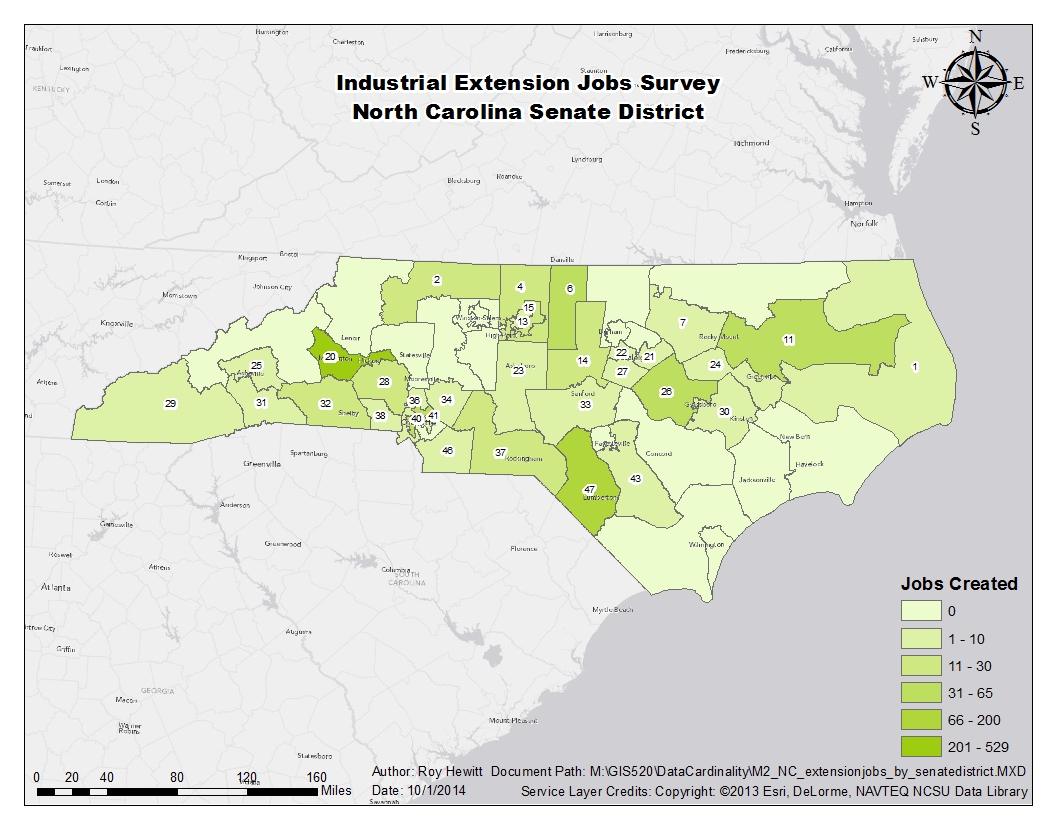
This map illustrates job growth in the Industrial sector by North Carolina Senate District.

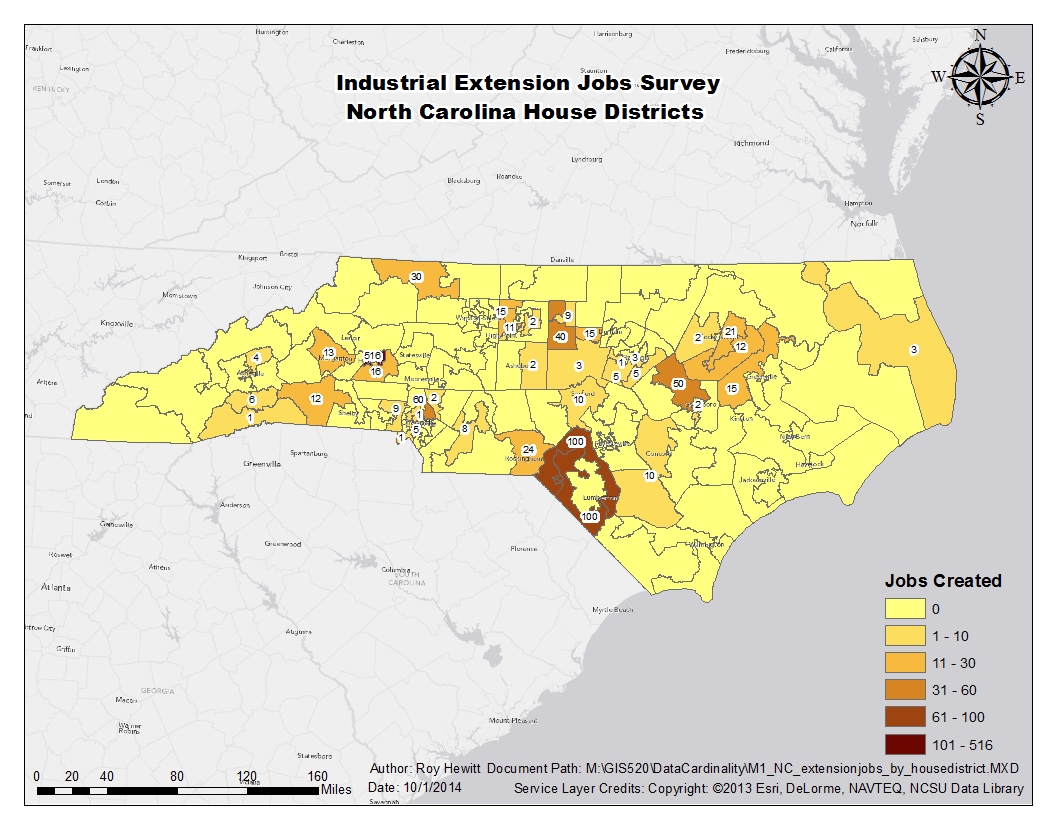
This map illustrates job growth in the Industrial sector by North Carolina House District.