Linear Referencing
Geospatial Analytics with Vector Data
Problem
This assignment covers the use of GIS to apply attributes to specific segments of a line with a technique called Linear Referencing. More specifically I analyzed the occurrence of accidents along segments of a road network and compared those accidents against both the type of material of the road, and the road’s condition.
Analysis Procedures
Strategies
To solve the problem I used the Linear Referencing tools available in ArcGIS to assign the attributes listed below to specific locations along the road network. The input datasets required were (1) a road network (line features), (2) a table of attributes representing specific location of traffic accidents along the road network, (3) a table of attributes representing specific segments of the road network representing the type of material that makes up the road. The fields containing road type were of type text, while the road condition was an integer between 0 and 100.
Methods
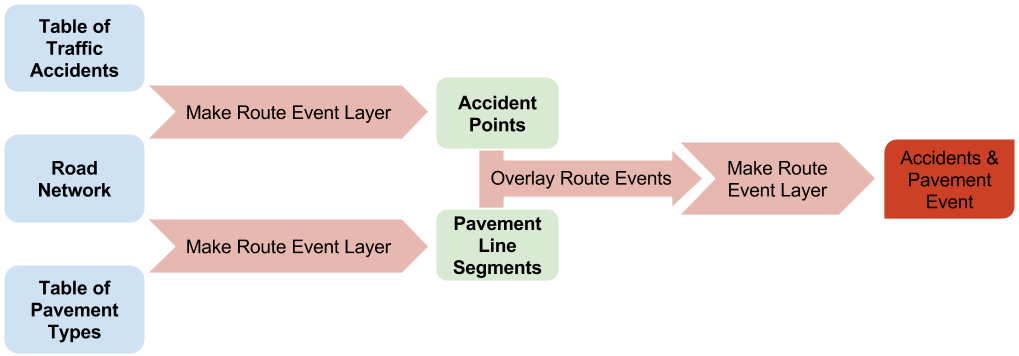
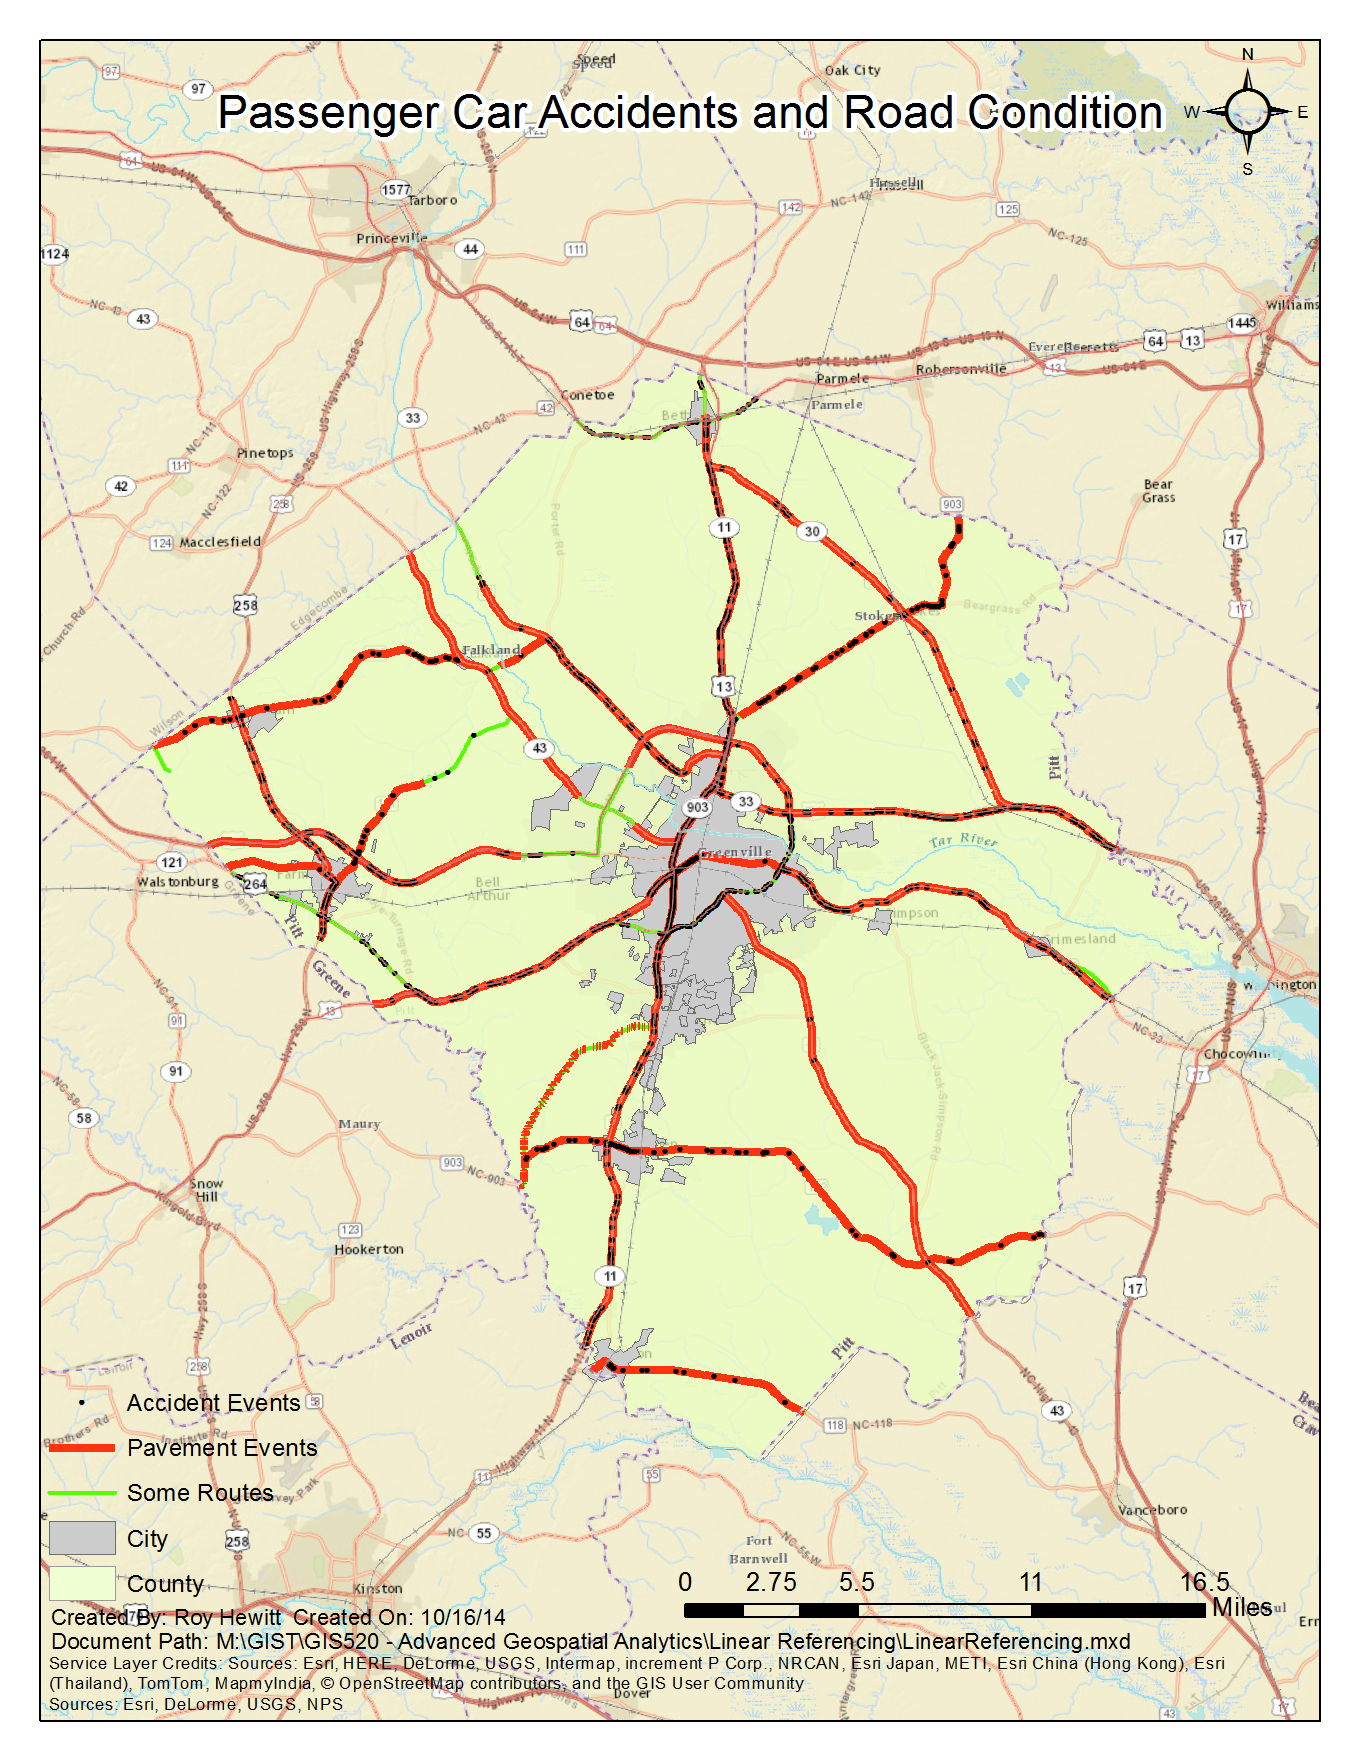
Connecting attribute data to segments of the road network was easy as most of the leg-work was already done for us. The attribute data already contained the necessary location along the network information required to connect the two datasets. As a result I was able to take the plain accidents table and create an event layer (a temporary in-memory feature class) from it which linearly referenced accidents to the road network. I could then use built-in tools to query all accidents along a particular route of the network. I repeated the same method using the pavement to create a line event layer representing the different materials used to pave road segments. This new layer contained a score representing the condition of the road between 0 and 100. Part of the exercise was to analyze whether a poor road condition led to an increased rate of accidents. I found that there was an insignificant difference (0.1) in the number of accidents per mile for roads with a score less than or equal to 75 as opposed to better maintained roads with a score greater than 75.

The diagram above shows the steps used to complete this exercise. Input datasets are in blue, processing steps are in light red, intermediate datasets are in green, and exercise outputs are in dark red.
Discussion
Difficulties
The first time I ran the make events layer geoprocessing tool I had one small line segment from the roads layer selected which limited the extent that the tool ran. The tool ran successfully for only that line and produced no output because no accidents fell within that line segment. Since the line was so small I didn’t notice it was selected. Finally I restarted ArcMap, which cleared my selection and everything proceeded correctly.
Evaluation
Based on a visual interpretation of my results the road accidents appeared along the correct line segments. The goal of the assignment, however, was to determine if accidents were associated with road condition. Without conducting a true statistical analysis it is impossible to determine if the results are statistically significant to suggest that road accidents are more prevalent along damaged road segments.
My results showed that poorly maintained roads (score less than or equal to 75/100) had only 0.1 more accidents per mile than those with a score of 76/100 or greater. I’m not particularly surprised by these results as there are many factors that contribute to traffic accidents. I would guess that road maintenance has a higher impact on the number of accidents per mile as the score drops more dramatically towards the 50/100 range.
Evidence suggests that distracted and intoxicated driving are some of the most dangerous variables contributing to accidents on the road. Both of these variables are unrelated to road condition. I would also assume that roads with high speed limits and a large density of on-ramps and off-ramps would also account for more accidents per mile.

Application & Reflection
Problem description
Identify dams and other stream barriers for removal that prevent fish from migrating up stream to spawning grounds.
Data needed
We need to make use of the NHD+ Version 2 stream/river network developed by USGS. USFWS species occurrence data that can be associated with line segments to represent where species are present and absent.
Analysis procedures
Linear referencing is a powerful tool anytime you are dealing with attributes along a line feature. In the Fish & Wildlife Service we often look at river and tributary segments that block migration of diadromous fish. While some dams offer a means for fish to migrate upstream to their typical spawning grounds many do not. Not only do some dams contribute directly to fish mortality as they try to swim through energy producing turbines, but they also contribute indirectly as adults of reproductive age are unable to find suitable spawning grounds.
With linear referencing in GIS we can assign attributes such as fish species presence/absence to particular reaches of rivers and streams. The nodes separating these dynamic segments are typically some sort of stream/river blockage that can be addressed through restoration work, which could include dam removals or fish passage projects. Once we have our stream network setup with barriers idetified as nodes we can select those nodes that would result in the greatest number of stream miles being opened up for fish migration. These are the types of barriers we would focus our restoration work to provide the greatest return on investment.