Suitability Analysis and Weighted Overlay
Geospatial Analytics with Raster Data
Problem
A recent trend in park visitors across the U.S. attempting to take Bear Selfies has led to increased interaction between bears and humans. Despite warnings park visitors continue to try to approach bears to post photos to instagram and other photo sharing services. Capturing and re-locating bears has proven to be unsuccessful as the bears continue to return. Based on several factors we will need to identify the safest areas for bears to reduce the amount of bear-human interaction.
For more, listen to the NPR story here:
Analysis Procedures
Strategies
We will be using the ArcGIS Spatial Analyst extension to model the best available bear habitat in the park to minimize human-bear interaction. We will use both raster and vector data inputs to create a bear suitability surface with a weighted overlay analysis. Our vector data inputs include line features representing streams, roads, and trails. Our raster input datasets include an elevation surface and a vegetation raster that describes the vegetation type of a given cell. The vegetation raster best represents habitat conditions for black bear.
Methods
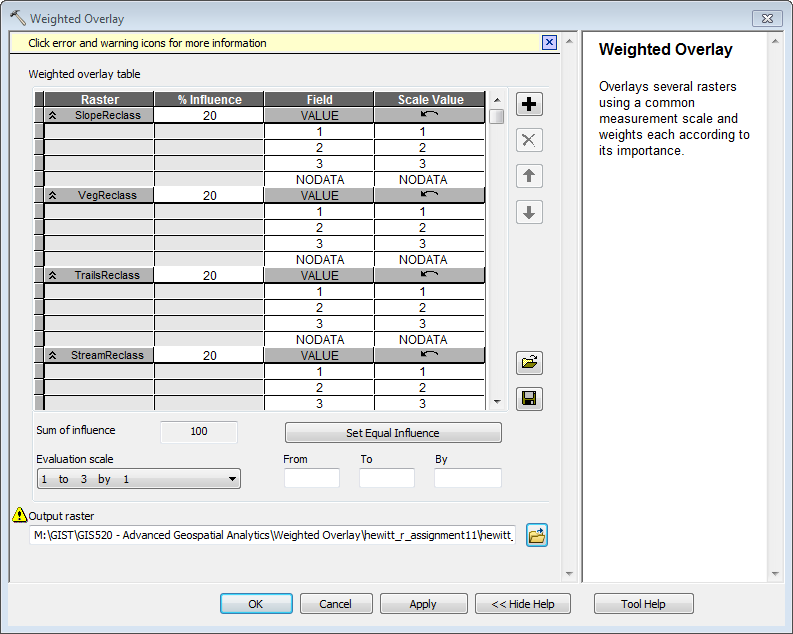
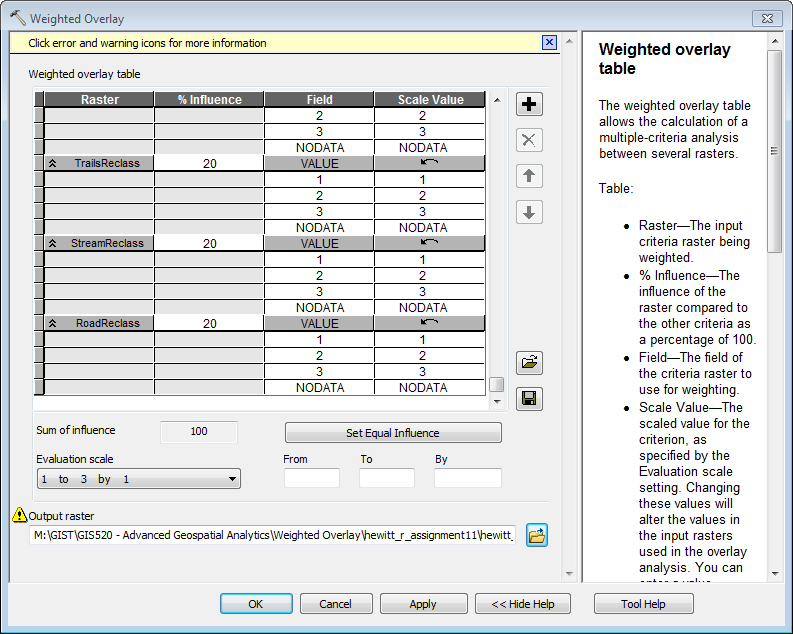
To conduct this analysis I need to convert all datasets to raster. I used the feature to raster geoprocessing tool to accomplish this. The next step was to convert the elevation surface to a slope surface using the slop geoprocessing tool. I then had to use the euclidean distance tool to derive a distance measure (raster) from the input vector datasets. Once I had all of my datasets in the correct form (raster), representing the correct features I could reassign their values to a consistent scale. Our model uses a scale of one to three with one being the least optimal and three being the most optimal. I used the reclassify tool paired with the research I was given on black bear suitability to convert all rasters to a common scale. I then fed the reclassified rasters into the weighted overlay tool where I gave each input the same (20%) weight to produce my final result.
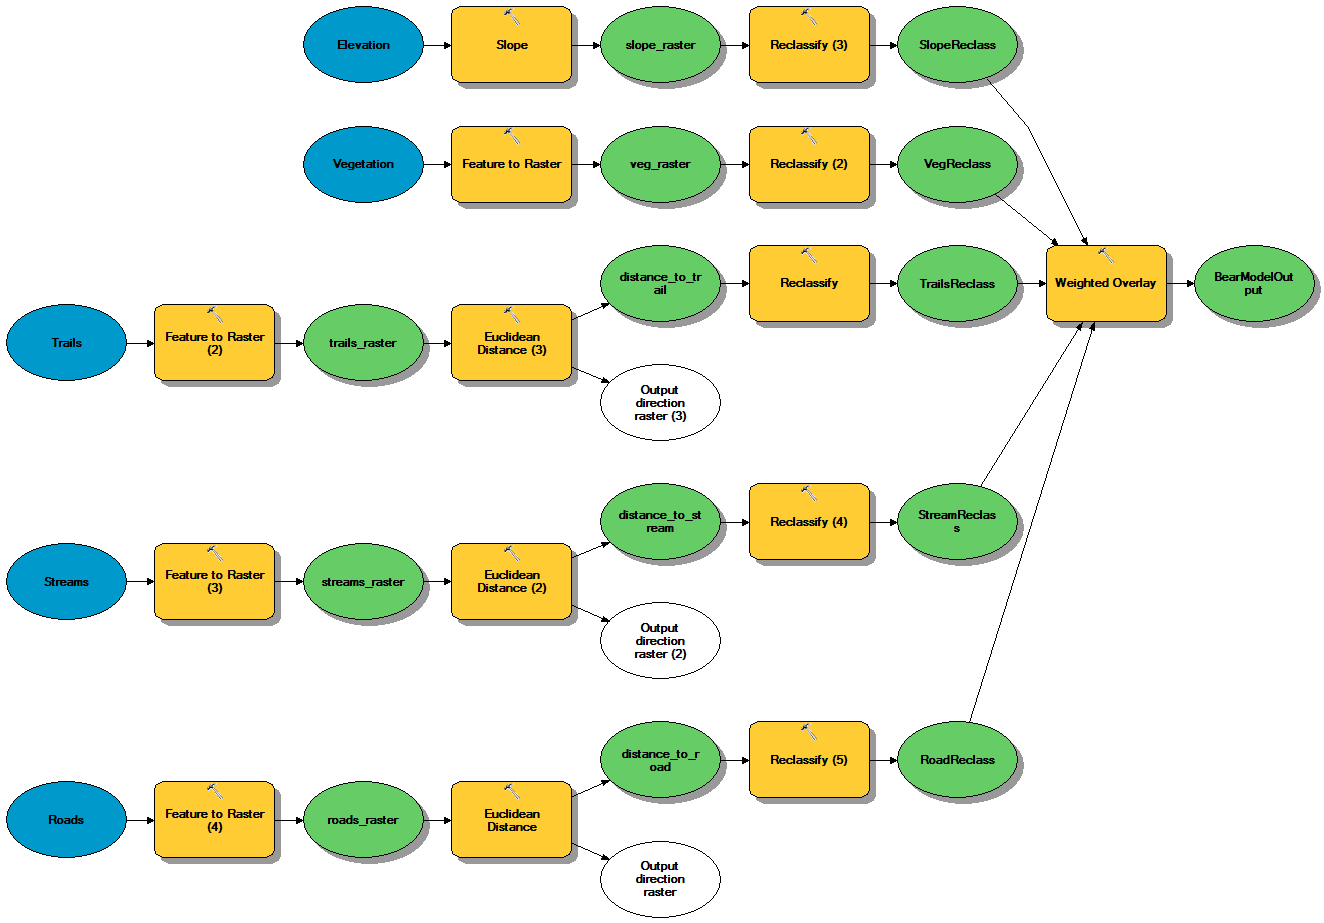
This diagram shows the series of geoprocessing tools that were chained together to create the bear suitability model. For this exercise I used Model Builder in ArcGIS to create and run my model.
Discussion
Difficulties Encountered
During the reclassification step I encountered a problem where a number fell outside the range that I dictated for my new one to three scale. In the tool I included the large number in my range, but the output didn’t take it into account. I went back into the tool using the results window, which auto-populates the tool as it was run previously. I then changed the value to the highest value +1 re-ran the tool and everything came together nicely.
Evaluation
I checked the output of each step of my analysis to ensure the results I got were what I expected. Anything that was incorrect at an early stage would follow through to the end of the analysis and it would be difficult to know exactly where the error occurred. Based on checking each individual step along the way and the final output, I am confident in my results that show a majority of pixel values with a score of two or three.
Application & Reflection
Problem description
We need to create a habitat suitability model for Gopher Tortoise throughout the Southeastern United States.
Data needed
Canopy composition data derived from LiDAr, SSURGO soil data, vector data for streams and roads, and information relating to forest management – specifically frequency of prescribed burns of pine habitats.
Analysis procedures:
To construct a habitat model for the Gopher Tortoise we would follow the same general analysis that we did for black bear. Gopher tortoises create a network of burrows that they use to evade predators. They also require an open canopy so their main food source of shrubs and grasses have an opportunity to grow. Finally the Gopher Tortoise needs to be close to a stream for a water source and prefers to be further from roads to prevent being impacted by cars.
I would need to convert all of the different layers to raster with the same cell size. Based on what I know about the tortoise’s biology I would use Euclidean distance tools on the stream and roads layer identifying a cut off for how close to streams and far from roads the animal must be. I would also select from a list of preferred tortoise soils selecting soils that are easier for the tortoise to excavate for burrows, and soils that drain well as to avoid flooded burrows. Using a raster of percent canopy cover derived from LiDAR I would select open canopy cells as they allow the tortoise to bask for temperature regulation and encourage growth of ground vegetation. Finally I would multiply all of the different layers together using raster math. Any cell that had a value of zero, or unsuitable habitat, would not be present in the final model. Areas that were suitable for a few of the habitat factors would be identified as somewhat suitable. Cells for which many of the required habitat factors were present would be identified as suitable.
This type of model would be helpful in two scenarios: (1) we have dollars that we can use to directly improve habitat to move it from one suitability class to a higher class, (2) target surveys in areas of high suitability that have no reports of the species. If we can show that a species is more widespread than previously thought it would prevent the risk of extinction if a meta population were lost in a stochastic event.
Model Parameters and Results
Road Reclassification
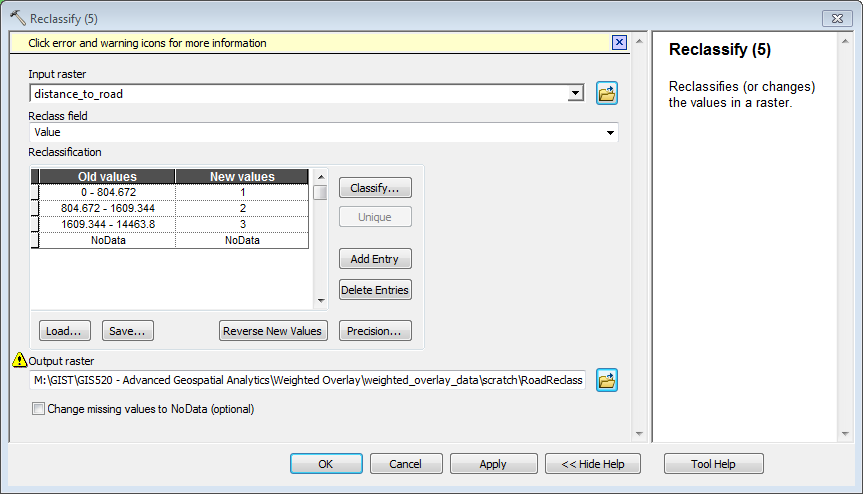
This reclassify tool shows that an increasing distance from roads represents a more favorable habitat for black bear.
Stream Reclassification
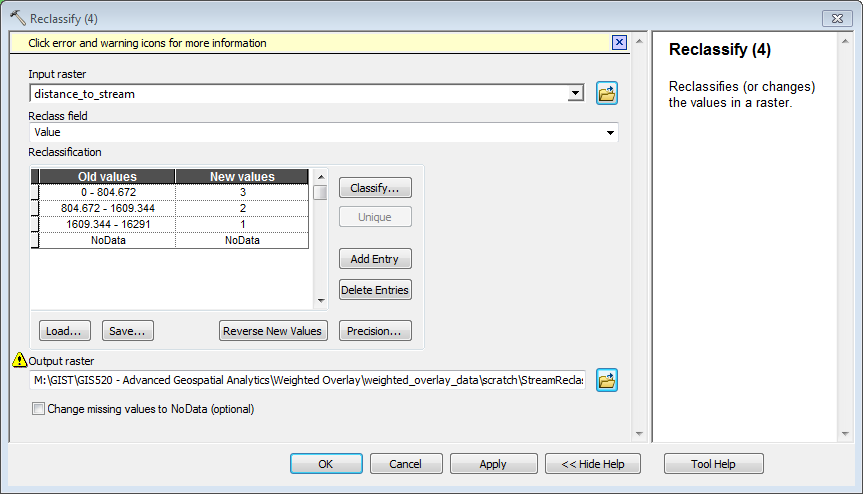
This tool shows necessity for water. As a raster cell gets closer to a stream, the favoraiblity score goes up.
Trail Reclassification
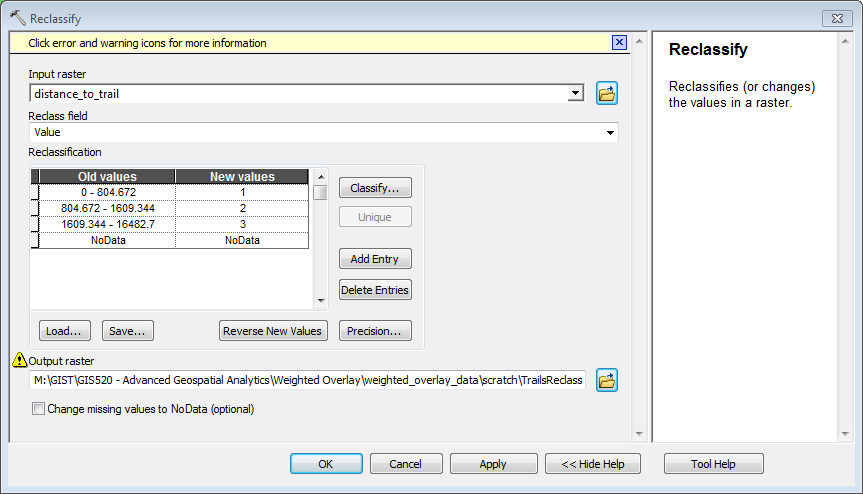
This tool shows one way we try to minimize human-bear encounters. Optimal habitat is located further away from trails in the park.
Vegetation Reclassification
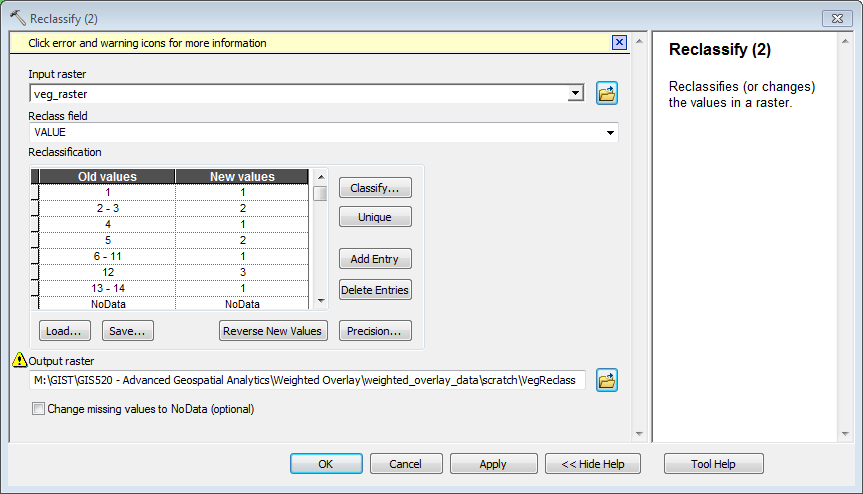
This tool categorizes different vegetation types into categories based on black bear’s habitat preferences. Habitat preferences are generally based on food availability and the ability to find trees and dens for escaping predators and raising young.
Slope Reclassification
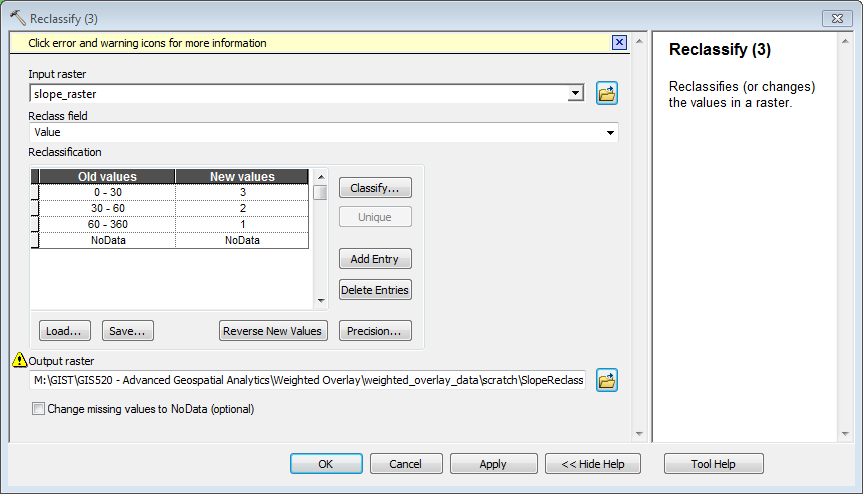
Bears do well in areas with lower slope. As slope increases it takes more energy to survive; therefore the favorability score decreases with increasing slope.
A screen capture of the Weighted Overlay dialog box’s table clearly showing all parameters. The image needs to show all fields for all input data (if needed screen capture the dialog box/table in two sections);
Weighted Overlay (2 photos)
Final Black Bear Habitat Suitability Model Output
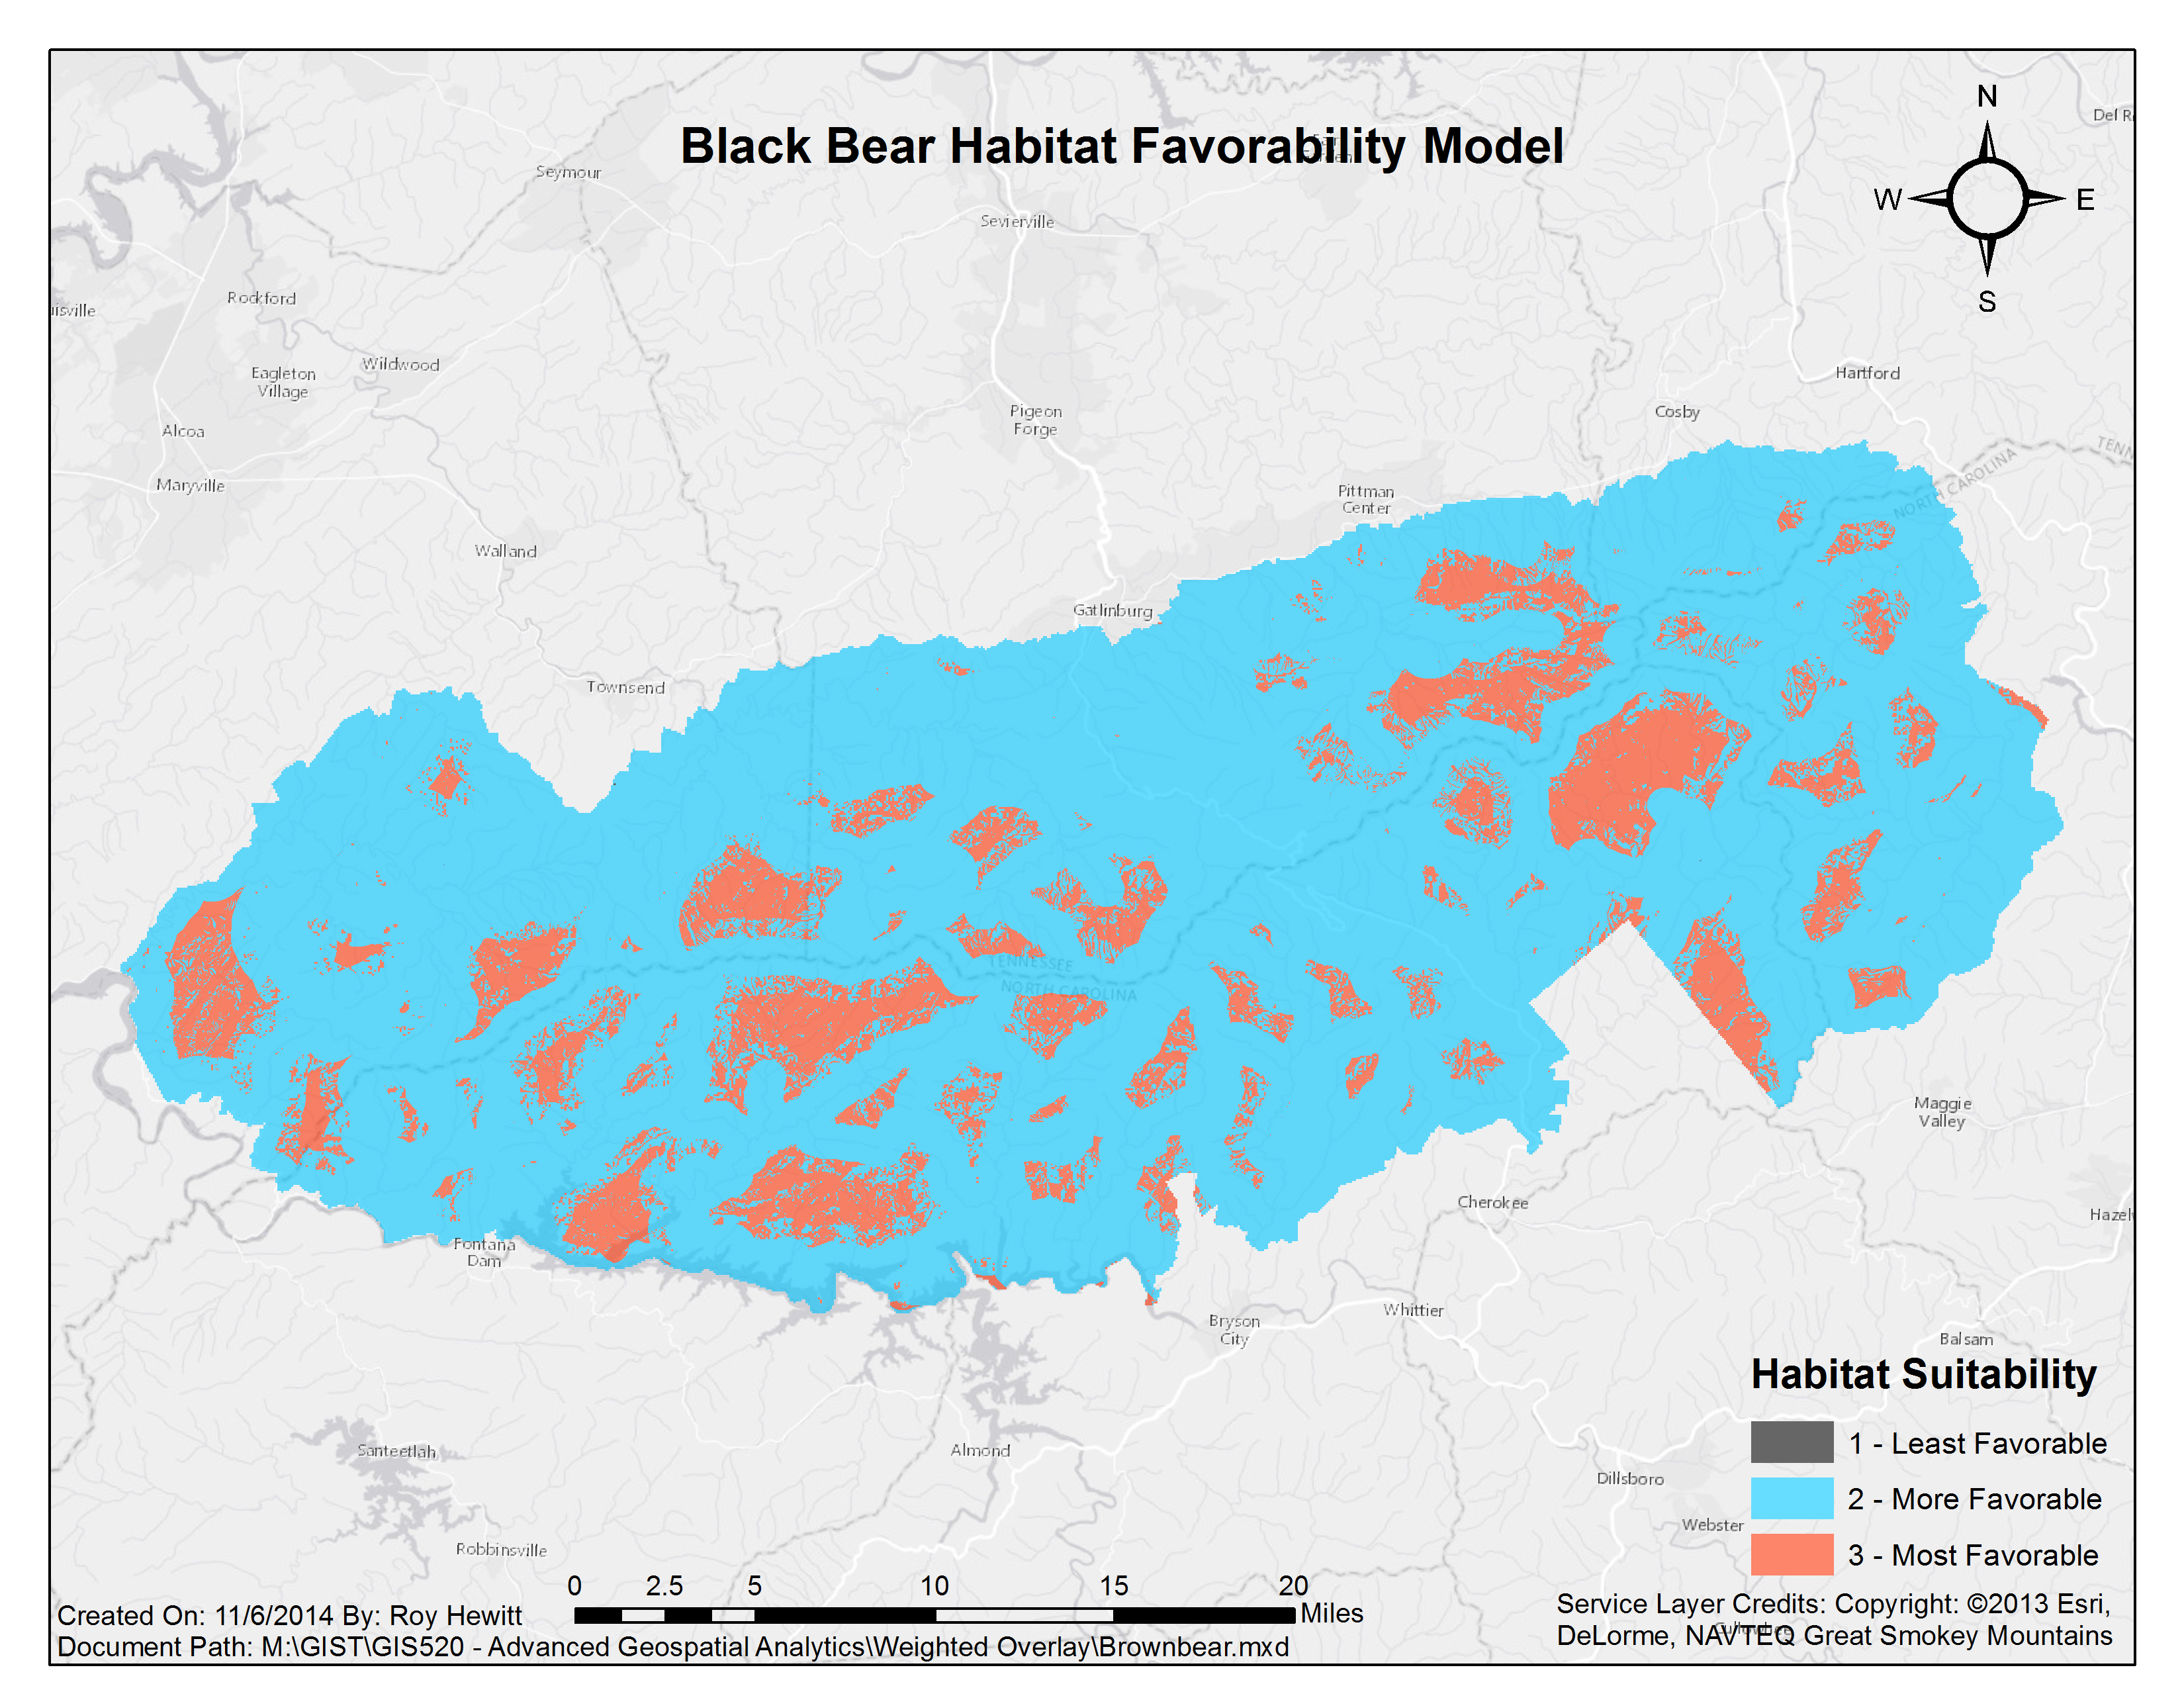
The final model shows areas that fall within the three habitat suitability categories. The good thing is that the majority of the park falls within More or Most favorable. The downside of the result is that the Most Suitable habitat is highly fragmented. Bears consume mostly nuts and berries, and as a result require a wide range to forage for enough food.